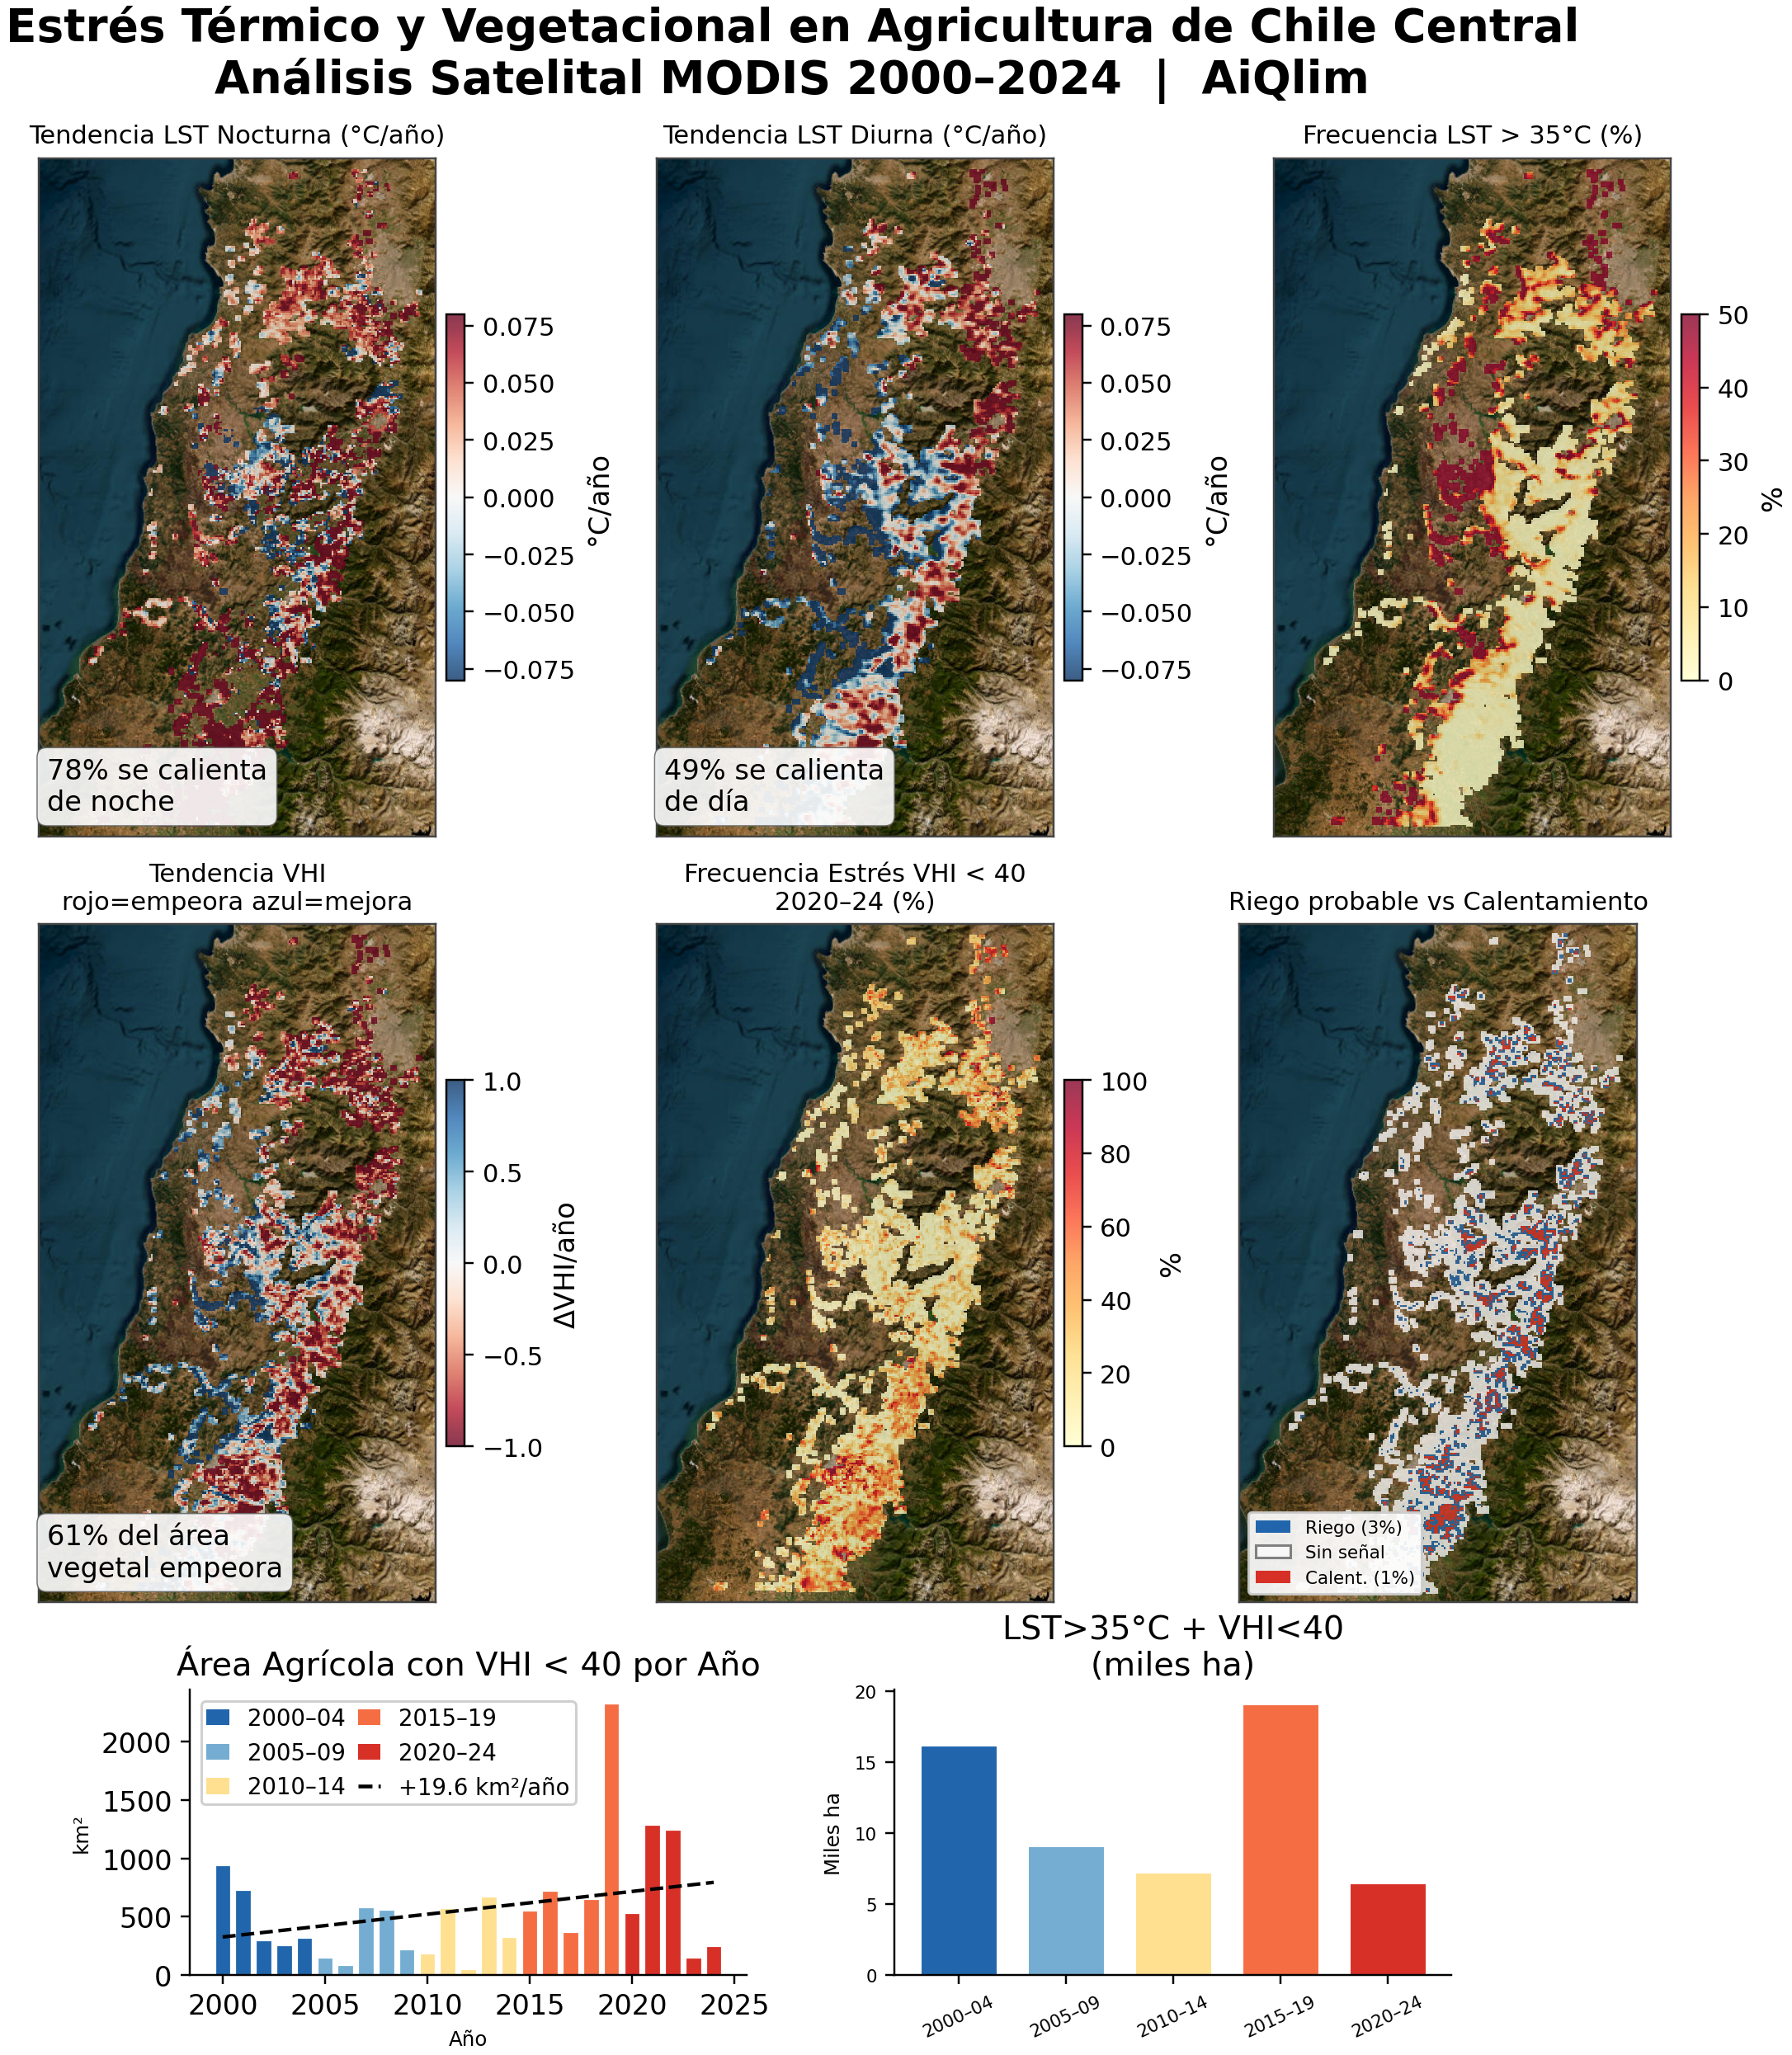
Central Chile —from Valparaíso to Biobío— hosts a transitional Mediterranean agricultural corridor, with dry summers and strong reliance on snowpack, irrigation and coastal influence. On that mask, for austral summers 2000–2024, the MODIS record shows a sustained thermal asymmetry: 78% of pixels show a positive trend in nighttime LST, compared with 49% for daytime LST. The pattern mirrors the Baldan et al. (2025) analysis of north-eastern Italian viticulture using the same product family.
Tracking change in the coupled thermal–vegetation system over a quarter-century requires long series, stable cloud-screened composites and auditable public layers. The Italian study, based solely on NASA MODIS, offered a transferable workflow; here it was replicated over the Chilean domain. What follows is a synthesis of the results.
What the temperature record shows
Land surface temperature (LST, Land Surface Temperature) is the quantity registered over soil and canopy; it is not the same as air temperature, although the two are often correlated. In this analysis it serves as a proxy for surface thermal loading, not as a direct measure of leaf physiology. The MOD11A2 product provides eight-day composites at 1 km, separating daytime and nighttime overpasses.
The contrast between 78% and 49% condenses decades of forcing in which the nighttime component accumulates a steeper positive trend than the daytime component, in line with regional-scale syntheses of global warming.
At crop scale the split has physiological meaning: at night respiration dominates, mobilising carbon assimilated in daylight. If nighttime temperature stays high, respiratory rate rises, net carbon balance falls and reserves are replenished less efficiently. In grapevines, tartaric acid, aroma compounds and anthocyanins are often the first attributes to shift; in cherries and other stone fruit, insufficient chill hours and phenological drift from the historical record are common signals.
In areal terms, four out of five hectares under the mask show warmer nights: this is not an isolated event but a background context on which heat waves or water-deficit periods are superposed.
Vegetation responds
The VHI (Vegetation Health Index) combines two readings on a 0–100 scale. The VCI (Vegetation Condition Index) compares current greenness with each pixel’s historical range. The TCI (Temperature Condition Index) applies the same logic to surface temperature with inverted sign: more heat implies less favourable values. Following the VCI–TCI scheme developed by Kogan (1997), this analysis built a combined vegetation health index as the simple average of both components, VHI = 0.5·VCI + 0.5·TCI; values below 40 and above 60 are read using the operational cut-offs common in satellite drought monitoring under that framework—critical and favourable, respectively.
Five-year blocks show a clear break toward 2010.
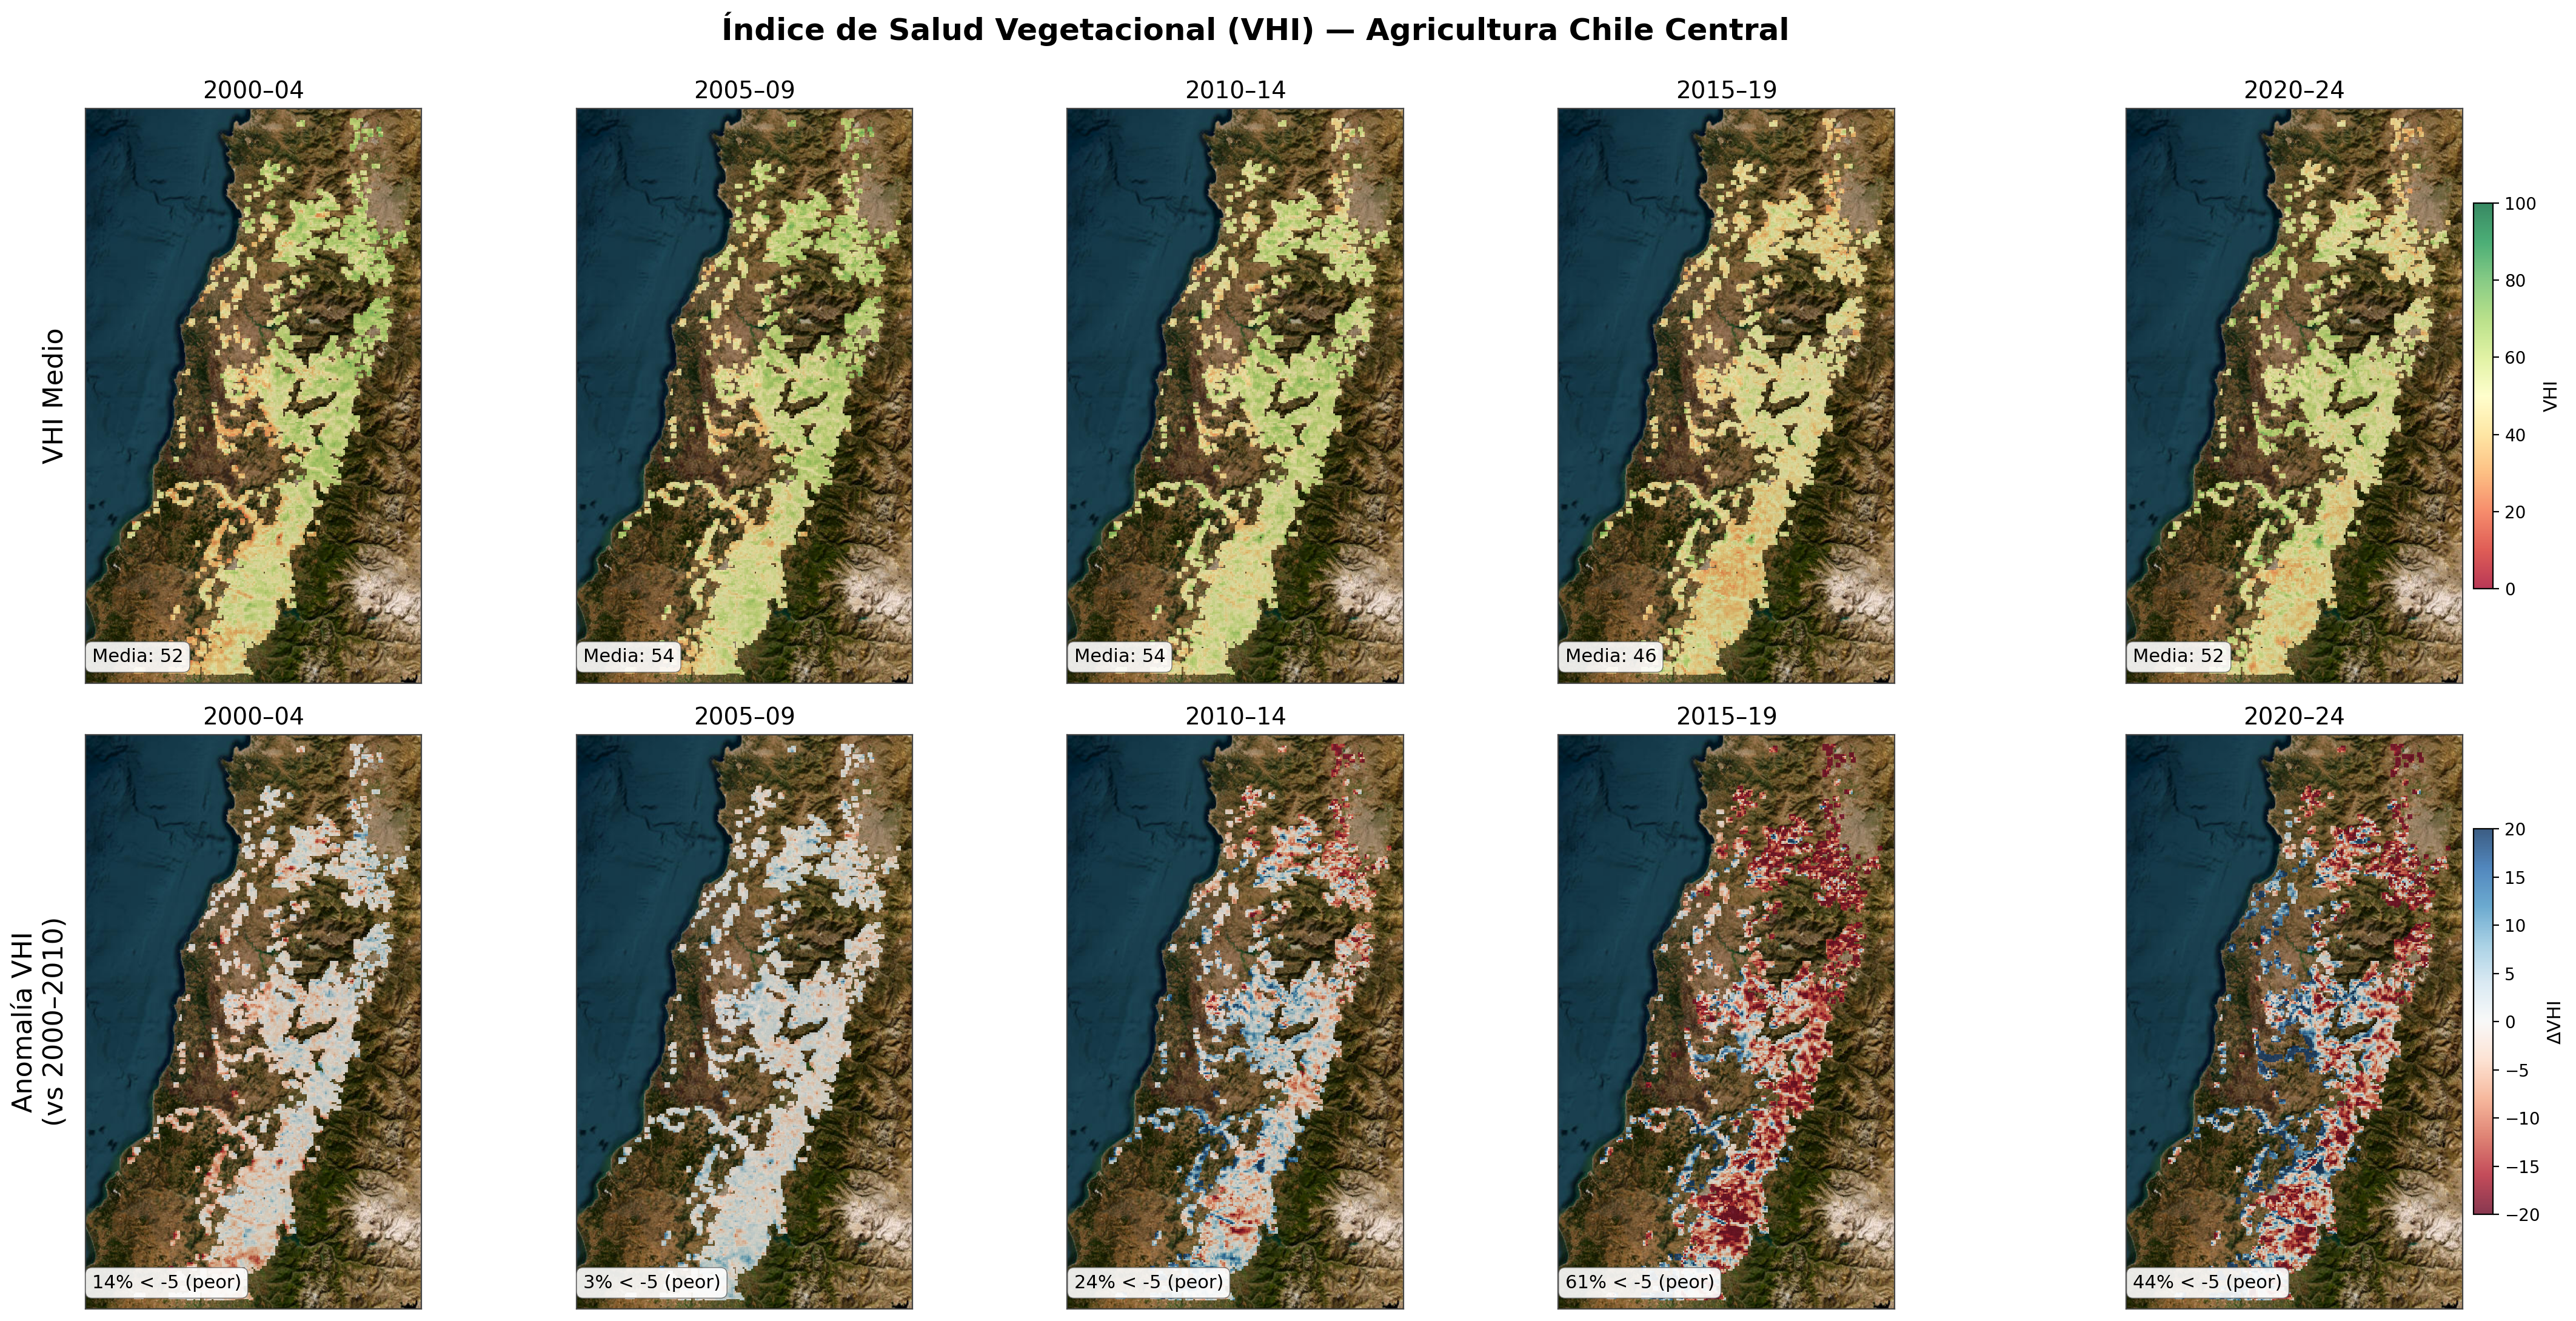
In 2000-2004 only 14% of the area falls below −5 relative to the baseline; in 2005-2009, 3%. In 2010-2014 the share jumps to 24%; in 2015-2019, 61%. 2020-2024 falls to 44%, still far from initial levels.
The dominant signal is meteorological, not instrumental. Central Chile’s mega-drought, documented from 2010 (Garreaud et al., 2020), ranks among the most severe continental water-deficit episodes in the instrumental record. Lower water availability associates with lower greenness and higher LST; VHI compresses that relationship into a single indicator.
Domain-mean VHI moves from 52 (2000-2004) to 54 in the next two five-year blocks, drops to 46 in 2015-2019—near the 40 threshold—and returns to 52 in 2020-2024. The recent recovery nonetheless rests on warmer nights accumulated across the full interval. The trend in area with VHI<40 amounts to +19.6 km² per year, i.e. almost twenty square kilometres more each season, on average, under the critical threshold adopted (VHI<40), consistent with operational practice of the VCI–TCI approach (Kogan, 1997).
It helps to separate blocks: the most adverse five-year window was 2015-2019, not 2020-2024. The most extreme individual years were 2019 and the 2021-2022 pair. Although institutional memory often centres on the pandemic, the interval of greatest accumulated load in the index is earlier.
East–west gradient: vegetation and water
NDVI summarises greenness from spectral reflectance; the NDWI (Normalized Difference Water Index) emphasises water content in the canopy. Both are derived from MODIS surface reflectance and, in this work, are expressed as linear trends 2000-2024 over the agricultural mask.
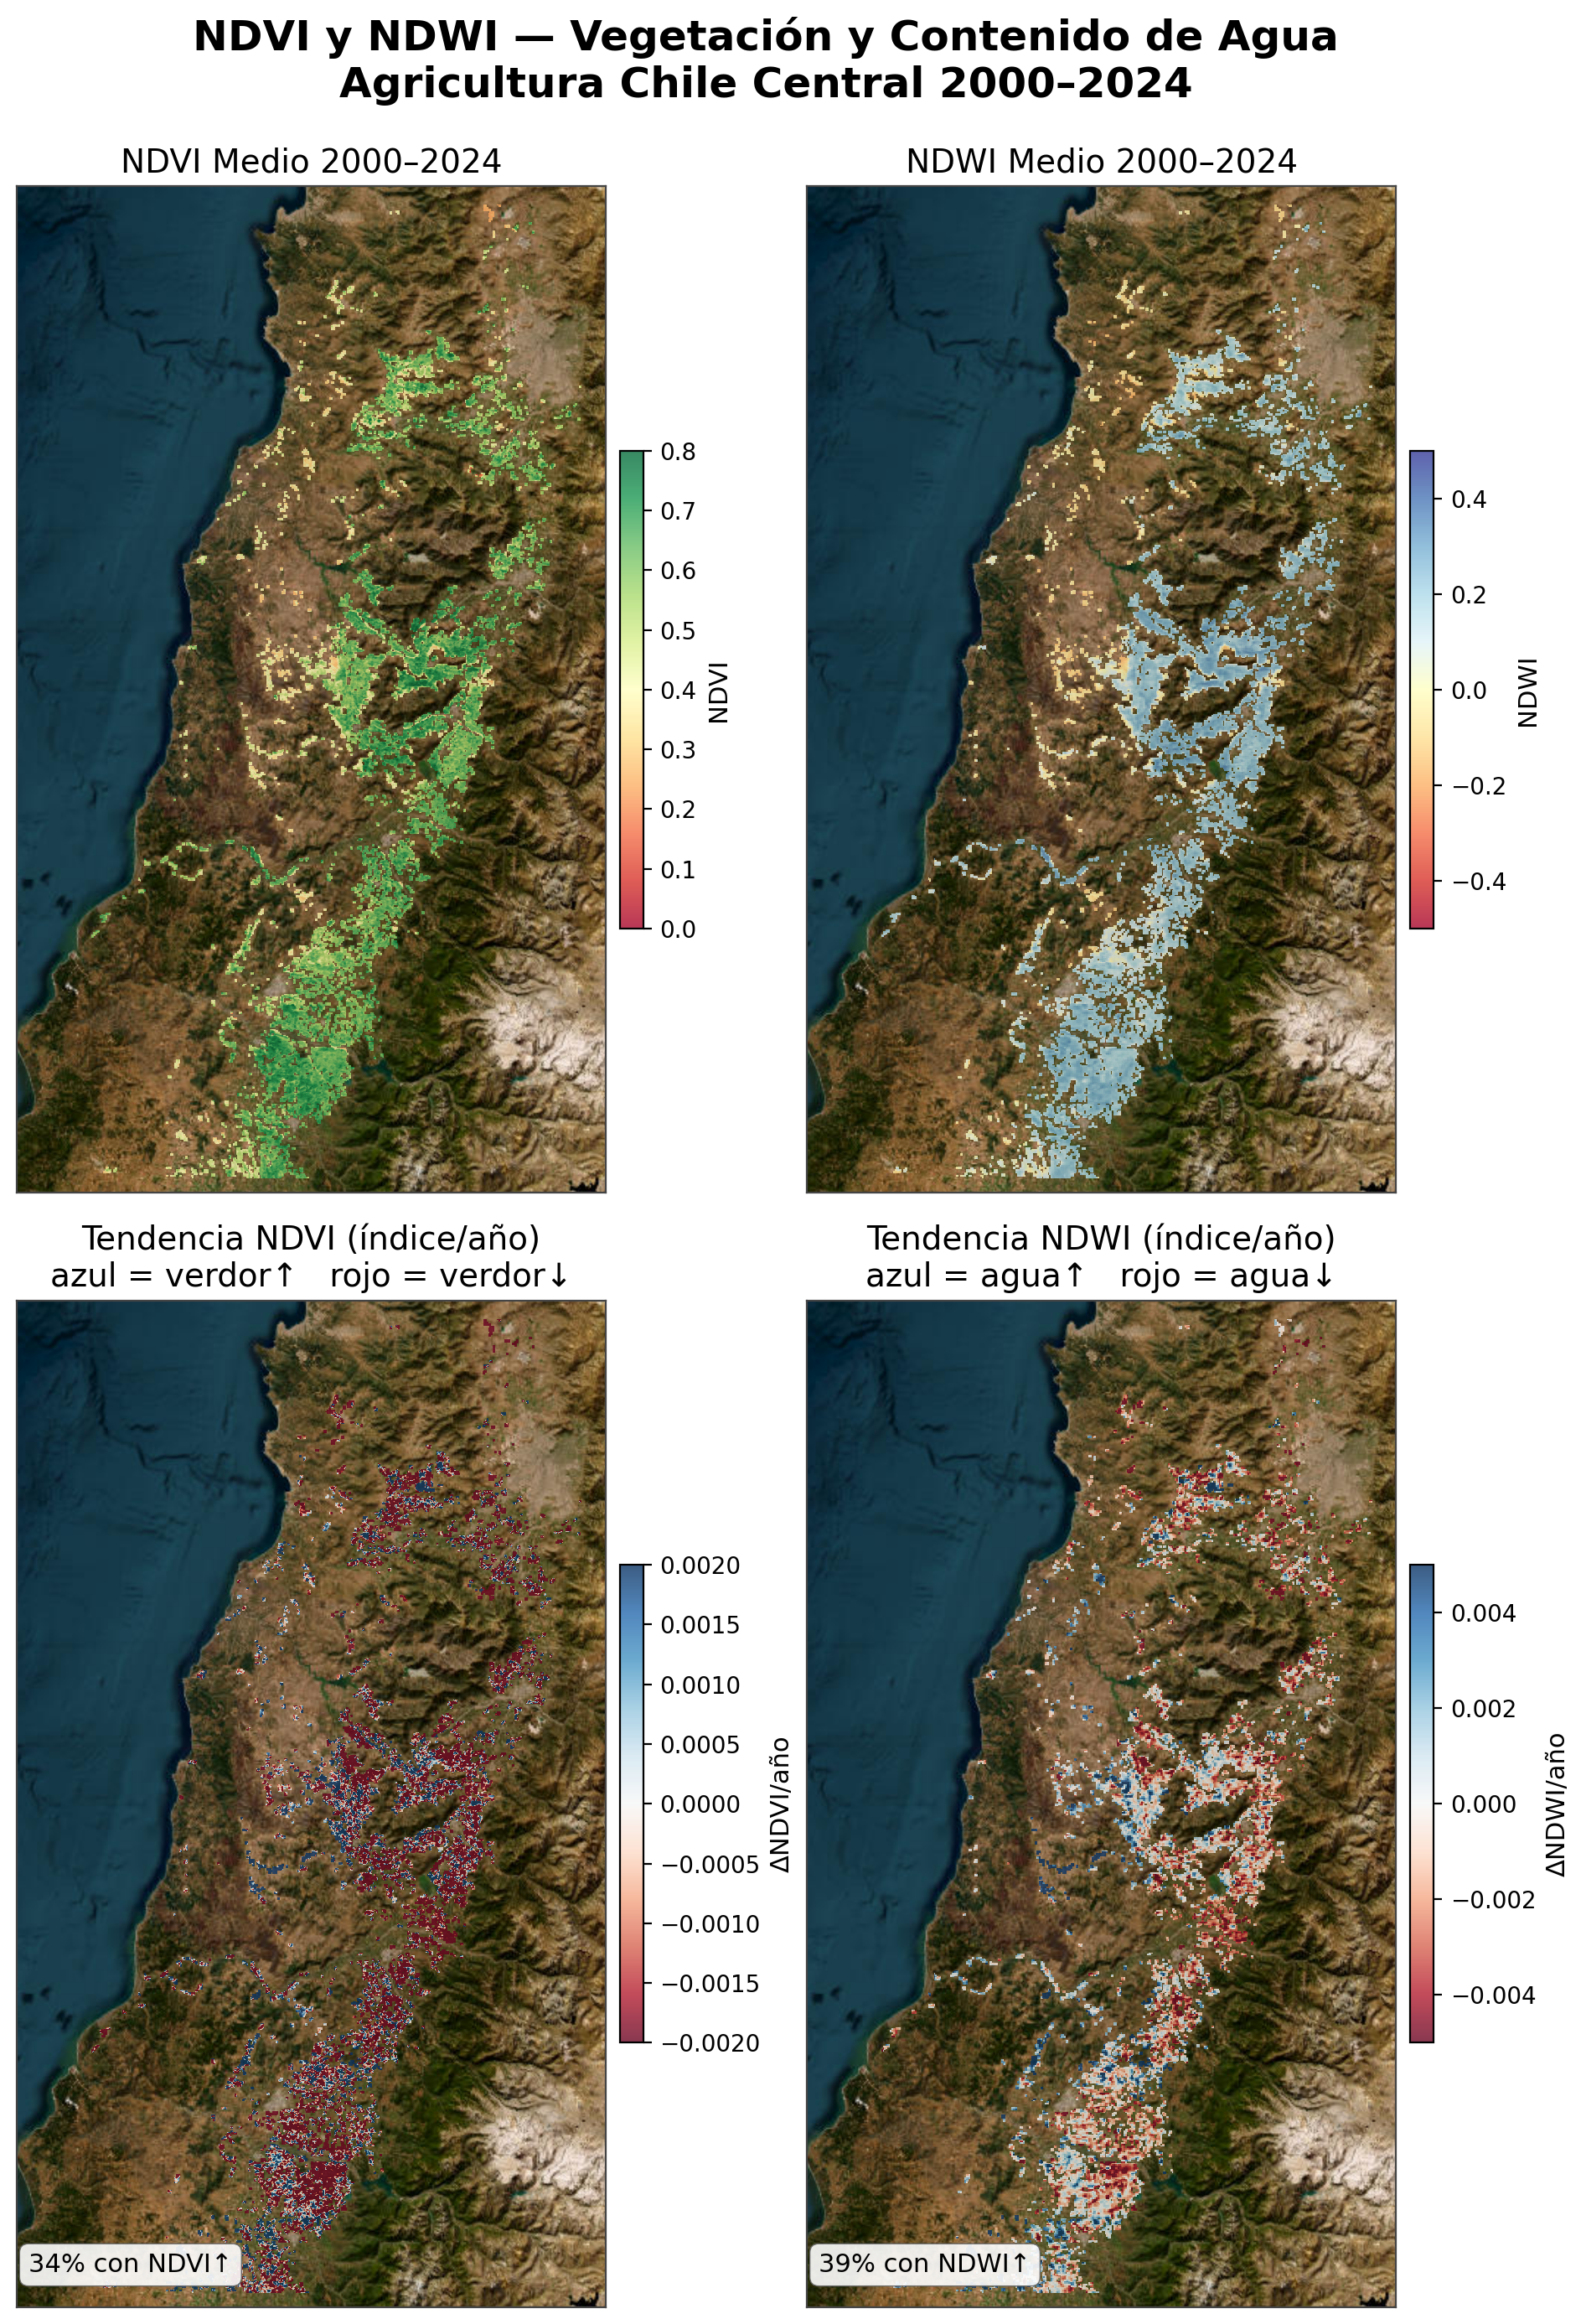
Only 34% of the area shows a positive NDVI slope and 39% for NDWI. Over most of the domain, greenness and foliar water stagnate or decline. The slope map is useful for locating where the trend reverses.
Positive slopes align with the irrigated Central Valley—Aconcagua, Cachapoal, Teno, Claro, Loncomilla—consistent with recent expansion of export fruit and technified vineyards under drip or micro-sprinkler. Beyond offsetting rainfall deficits, irrigation allows new productive area to come online.
The precordillera, coastal rainfed stretches and reaches with sparser hydraulic networks lose greenness and canopy water. The contrast between irrigation and rainfed farming sharpens.
An LST–NDVI cross-tabulation seeks an “irrigation effect”: lower temperature and rising greenness. Only 3% of total agricultural area meets that criterion. 1% shows the opposite (warming and declining greenness). The remaining 96% lacks an unambiguous signature: irrigation may operate below MODIS effective resolution (~1 km), or underlying processes are too complex for a binary cross-check.
Conclusions and implications
Taken together, the indicators point in one direction: central Chile agriculture now operates with warmer nights, a VHI that does not restore the pre-2010 regime, and a hydrologic–productive map split between irrigated valley and rainfed land. The pattern is not uniform, but three features recur.
- The nighttime LST component shows a steeper positive trend than the daytime component, with implications for quality and carbon balance in sensitive crops.
- The mega-drought from 2010 marks a before-and-after in agricultural biomass status; the latest five-year block improves on the worst stretch but does not reinstate the prior regime.
- Pressurised irrigation dampens the signal where it reaches, yet the footprint detectable at 1 km covers only 3% of total agricultural area.
For territorial planning the implication is direct: zoning grounded in historical climatic suitability is outdated across much of the commune network. Deficit scenarios toward 2040 already had a prolonged trial run—more than ten years of mega-drought. If area under VHI<40 keeps expanding at this pace, satellite monitoring ceases to be an optional add-on and becomes part of the minimum input set for both water policy and farm-level management.
Contrast with the Italian case adds context: same indices, same time window, same sensor. In north-eastern Italy the adaptation debate is further advanced. In Chile the series are already built; the remaining step is to fold them systematically into decisions.
MODIS data
MOD11A2 (day/night LST, 1 km, 8-day), MOD13Q1 (NDVI, 250 m, 16-day), MOD09A1 (surface reflectance for NDWI, 500 m, 8-day), MCD12Q1 (agricultural land-use mask).
Indicators
Mean LST and daytime/nighttime trend; VHI as combined VCI–TCI index (VHI = 0.5·VCI + 0.5·TCI), following the VCI–TCI scheme of Kogan (1997); frequency of LST > 35°C and VHI < 40; five-year anomalies relative to the 2000-2010 baseline; NDVI and NDWI trends.
Processing
Own elaboration based on NASA MODIS products and the methodology published by Baldan et al. (2025).
Study period
Austral summers (December–February) 2000-2024.
Baldan, V., Straffelini, E., D'Agostino, V., Tarolli, P. (2025). Northeast Italian viticulture affected by heat and vegetation stress. Agricultural and Forest Meteorology 378, 110962.
Garreaud, R. D., Boisier, J. P., Rondanelli, R., Montecinos, A., Sepúlveda, H. H., Veloso-Aguila, D. (2020). The Central Chile Mega Drought (2010–2018): A climate dynamics perspective. International Journal of Climatology, 40(1), 421–439.
Kogan, F.N. (1997). Global drought watch from space. Bulletin of the American Meteorological Society 78, 621-636.